
Below the surface.
Structures. Contacts. Contrasting responses. A framework for investigation—not proof of a deposit.
Following structures. Testing contacts.
Yanks Peak sits in the Barkerville Terrane. Snowshoe Group metasedimentary rocks include quartzite, phyllite and carbonate units. Folding, faulting, shearing and quartz–carbonate veins provide a framework for investigating structurally controlled gold. [2, 4]
Where did fractures create fluid pathways? Where might veins repeat or widen? Do contacts and structural intersections coincide with reproducible geochemical and geophysical evidence?
Magnetics: a geological framework.
The September 2018 total-field magnetic plan records contrasting domains across the historical survey grid. These can help investigate lithological boundaries, magnetite-bearing rocks, possible intrusive relationships and structural disruption. A magnetic high is not proof of gold mineralization. [ARIS 37933, pp.28–30, 48]
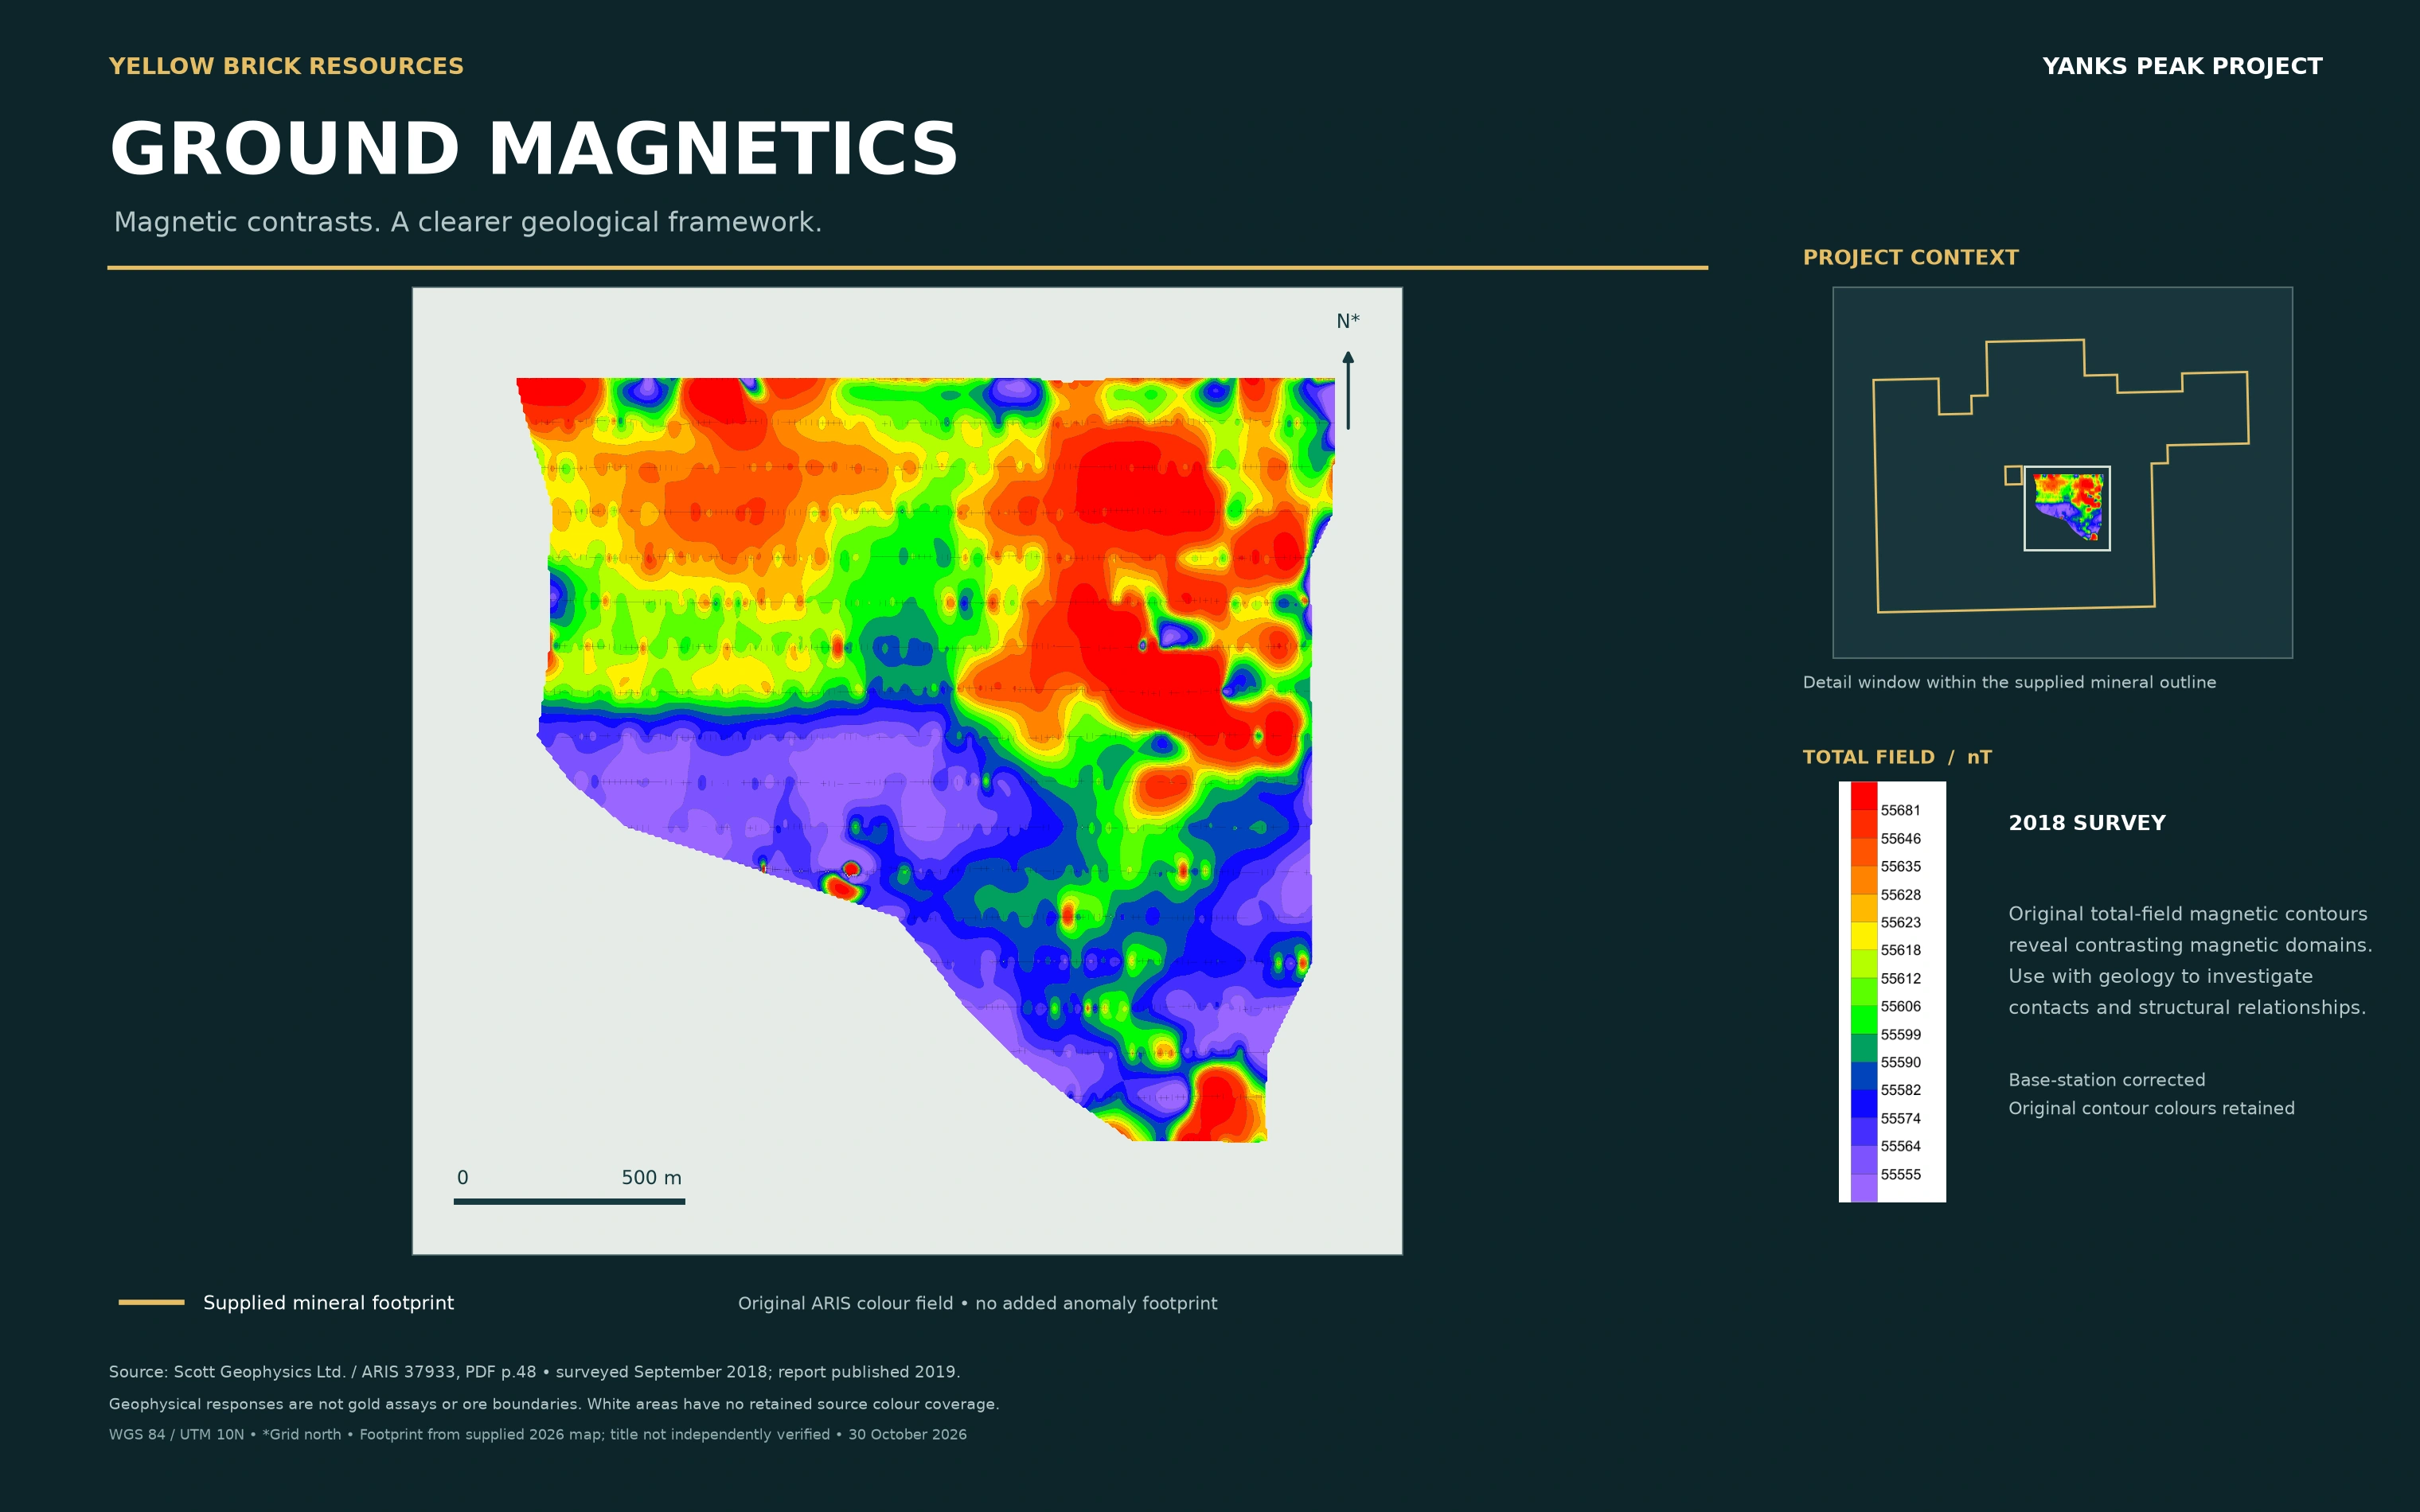
Open full-resolution map (PDF) ↗
Electrical responses: a question worth testing.
The 2018 first-separation chargeability plan shows an elevated response near the eastern end of the grid, accompanied by a resistivity contrast. The report interprets the northeastern composite feature as a possible sulphide-enriched intrusive body associated with magnetite and faulting. This remains a hypothesis, not a confirmed intrusion or economic discovery. [ARIS 37933, pp.30–32, 71–72]
Graphite, relatively barren sulphides, water-bearing fractures and rock contrasts are alternative explanations. The northwestern magnetic feature does not have the same IP/resistivity support as the northeastern feature.
The 1990 holes encountered graphite and sulphides relevant to electrical responses; selected core remained unassayed when reported. Reviewed 2005 core summaries reported low gold values. These results constrain the targets tested and remain part of the interpretation.
Read each method on its own terms.
What do the colours measure?
Total-field magnetics are in nanoteslas (nT); apparent chargeability in mV/V; apparent resistivity in Ωm. Each map retains its own original numeric legend. Colours cannot be compared quantitatively across methods.
Are the IP maps slices at 100 metres depth?
No. They show pole–dipole first separation, a = 100 m and n = 1. These are apparent-response plans, not depth slices or inversion models. Four surveyed lines underlie the interpolated plans.
Does the coloured area show mineralization?
No. It is the report’s interpolation or survey footprint, not a mineralized footprint. White or transparent areas do not imply measured zero. Coverage has not been expanded to fill the supplied mineral outline.
What would establish a stronger target?
Geological control, verified locations and direct sampling must distinguish between competing explanations. An anomaly alone does not establish gold content, continuity, economic potential or a resource.